On December 9, 2020, DOPC versus DOPE as a helper lipid for gene-therapies: molecular dynamics simulations with DLin-MC3-DMA was published on PCCP (Phys Chem Chem Phys) [1]. In this paper, two liposome-based systems were constructed through combining the cationic lipid DLin-MC3-DMA with two different helper lipids (DOPC and DOPE) for molecular dynamics simulations. The dynamics simulation study was carried out only targeting the lipid bilayer system constructed by a single component and a cationic lipid, and there was a lack of analysis of the interaction between more lipid components and liposome complexes and the cell membrane. However, the use of molecular simulation in analyzing the structure of the constructed lipid bilayer system makes it possible for the rational design of liposomes with the help of computer in the future.
Abstract:
Ionizable cationic lipids are the important components of lipid nanoparticles (LNPs) in the drug delivery systems for gene therapy. DLin-MC3-DMA is one of the most promising ionizable cationic lipids (or amine lipids). Based on their application in drugs, these nucleic acid-loaded LNPs also contain various helper lipids, such as phospolipid, pegylated lipid, and cholesterol hp. It is relatively difficult to refine the structures of LNPs used in practical gene therapy due to their complex compositions, and the role of each lipid in the pharmacological properties of LNPs has not been determined. In order to investigate the possible effect of the phospholipid headgroups on the cell membrane in LNPs, an atomistic model for the neutral form of DLin-MC3-DMA was established in this study, and all-atom molecular dynamics (MD) simulations were carried out. The bilayer systems formed by DLin-MC3-DMA of two different molar ratios (5% and 15%) with different phospholipids DOPC and DOPE were constructed and simulated at neutral pH of 7.4. The analysis of MD trajectories showed a strong interaction between DOPE lipid headgroups and DLin-MC3-DMA, which was not found for DOPC lipid headgroups. In addition, the relatively strong interaction between DOPE and DLin-MC3-DMA allowed the positioning of DLin-MC3-DMA on the membrane surface. The lateral diffusion of two bilayer systems was slowed down by the interaction between lipids, where a more significant decrease in the diffusion rate was observed in the system with DOPE. This is also the reason for a low water permeability of the lipid bilayer systems containing single-component DOPE, which may be related to the poor transfection properties.
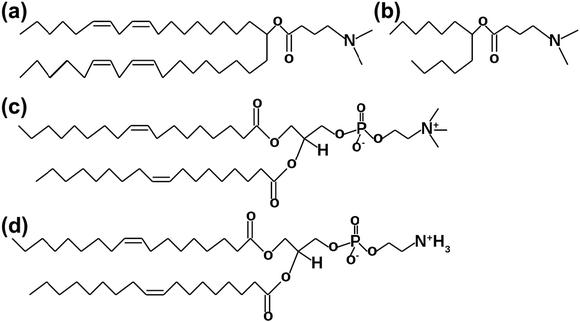
Fig. 1: Lipid structures for MD simulations. (a) DLin-MC3-DMA. (b) Part of DLin-MC3-DMA for the parametrization of force field (FF). (c) DOPC, 18:1 (Δ9 - cis) PC. (d) DOPE, 18:1 (Δ9 - cis) PE.
Simulation method:
1. Parametrization of the model for DLin-MC3-DMA
The model for DLin-MC3-DMA was developed by reference to the principle for polyunsaturated phospholipids. Since the pH around an LNP is usually neutral, the total molecular charge was set to zero for simulating the state of ionizable cationic lipids under neutral conditions. The ionized form of this compound will not be used in MD simulations.
The force filed (FF) parameters of DLin-MC3-DMA were derived with reference to the existing SLipids FF for polyunsaturated phospholipids. The general forms of SLipids FF are as below:
EFF = Ebonded + Enon-bonded
Ebonded = Eangles + Edihedrals + Ebonds + EUrey-Bradley
Enon-bonded = ELennard-Jones + ECoulomb
This study focused on the calculations of the charges and the dihedral parameters for the lipid headgroups; while the dihedral parameters for the lipid tails were taken from the SLipids FF for the identified polyunsaturated lipids, and the charges for the tails can be slightly adjusted by reference to the existing charge.
The all-atom quantum chemical calculations for DLin-MC3-DMA require a relatively long time and relatively large computer memory. In this study, therefore, the quantum chemical calculations were carried out for the equivalent small model of DLin-MC3-DMA (Fig. 1b) using B3LYP with the basis set CC-pVTZ in Gaussian 09 software together with the restrained electrostatic potential approach (RESP). In the polarizable continuum model using the integral equation formalism variant (IEFPCM), the headgroups of DLin-MC3-DMA were placed in a polarizable continuum with a dielectric constant of 78.4, in order to mimic the solvent effects and their induced polarization on the charge distribution. Specific charge parameters are shown in the supporting documents.
New dihedral parameters were derived by referring to the philosophy as in the previous version of SLipids FF after partial atomic charges were calculated, as shown in Fig. S2 in the supporting documents. The original molecular model was optimized with the second-order Møller-Plesset perturbation theory (MP2) and CC-pVDZ basis set, as in the SLipids FF for polyunsaturated lipids. In order to optimize the molecule, various conformations were created by rotating around the dihedral with a step of 10 degrees in the interval from -180 to 180 degrees, keeping other degrees of freedom constant; the energies and distribution of charges of different conformations were calculated, and the optimal conformation was selected. The relative quantum mechanical energies of different conformations were calculated by the hybrid method for interaction energies (HM-IE), with the relations as below:
ECCSD(T)/BBS = ECCSD(T)/SBS + ECCSD(T)/BBS − ECCSD(T)(SBS) ≈ ECCSD(T)/SBS + EMP2/BBS − EMP2/SBS
Where MP2 refers to the second-order Møller-Plesset perturbation theory, CCSD(T) represents the coupled cluster singles and doubles and perturbative triple excitation method from the coupled cluster theory, SBS refers to the small basis set (CC-pVDZ), and BBS refers to the big basis set (CC-pVQZ).
The values obtained through the high-order quantum chemical calculations were used for fitting the dihedral potential via the equation below:
Edihedral = (ECCSD(T)/BBS − EMD) − (ECCSD(T)/BBS − EMD) min
Where EMD represents the value of the potential energy, which was obtained using MD software when the dihedral parameter is set to zero. The threshold for the fitting of dihedrals was approximately 2 kJ/mol. The new dihedral parameters were used for DLin-MC3-DMA, and new atom types CTL6, NL and CL2 were added to the FF. Other FF parameters, such as the bond length, missing values for dihedrals, and Urey-Bradley and angular parameters, were taken from the previous atom types (CTL5, NH3L and CTL2) in the SLipids FF and the CHARMM36 FF.
2. Parameter setting for MD simulations
The simulation systems are shown in Table 1. Firstly, two lipid bilayer systems were constructed, with one containing DOPC only and the other containing DOPE only. Each bilayer was composed of 100 membrane monomers containing two phospholipids, with one in the upright position and the other in the inverted position (non-mirror symmetry). The constructed bilayers were utilized for creating liposome complexes containing DLin-MC3-DMA of different molar ratios. Phospholipids were deleted in these lipid bilayers in the selected places (with a distance of 10 A), which were replaced by the optimized molecules of DLin-MC3-DMA.
Table 1 Compositions of the simulation systems
Lipid | Number of PCs/PEs | Number of DLin-MC3-DMA | Number of water molecules (TIP3P) |
DOPC | 190 | 10 | 8,000 |
DOPC | 170 | 30 | 8,000 |
DOPE | 190 | 10 | 8,000 |
DOPE | 170 | 30 | 8,000 |
DOPC (pure) | 200 | 0 | 8,000 |
DOPE (pure) | 200 | 0 | 8,000 |
Each constructed system was equilibrated for 300 ns in the NPT ensemble, followed by simulation for optimized 300 ns (a pressure of 1 atm during simulations was adopted, and pressure coupling was conducted using the Berendsen barostat, keeping the temperature constant at 298 K). The calculations for the simulations were performed based on the Newton’s equation of motion with a time step of 2 fs and using a van der Waals force Verlet cut-off scheme with a cut-off radius of 1.2 nm. The bond length was constrained through 12 iterations using the LINCS algorithm. The analysis of MD simulations and trajectories was performed using gromacs-4.6.7 software.
3. Optimal settings for dynamics simulations
Four systems, containing DLin-MC3-DMA, underwent equilibrium MD simulations. The systems reached a steady state after the energy was minimized. Five different starting conditions were created for each simulation system, which were used for 5 parallel dynamics simulations per liposome complex.
The collective variable (CV) was considered as the distance between the center of mass of the water molecule and a lipid bilayer (see Fig. 2). The height was defined as 1.2 kJ/mol by Gaussian function. Their width was 0.05 nm (parameter σ), depositing every 500 steps (the value of the parameter PACE). The bias factor γ was set to 10.0 due to the small water molecule.
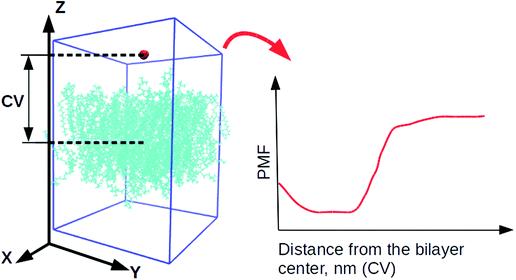
Fig. 2: Collective variables for initial dynamics simulations. Small red molecules are water molecules, and cyan molecules are lipids. All other water molecules are omitted for clarity. "CV" refers to the collective variable, and "PMF" refers to the potential of mean force.
All simulations were performed in the NVT ensemble at a constant temperature of 298 K, using the V-rescale thermostat. The integrator for Newton's equation of motion was leap-frog with a time step of 2 fs and a Verlet cut-off scheme with a cut-off radius of 1.2 nm. The bond length was constrained through 12 iterations using the LINCS algorithm. The analysis of MD simulations was performed using gromacs-4.6.7 software, with plumed-2.1.262 software for the calculation of free energy. Each simulation lasted for 150 ns.
Results and discussion
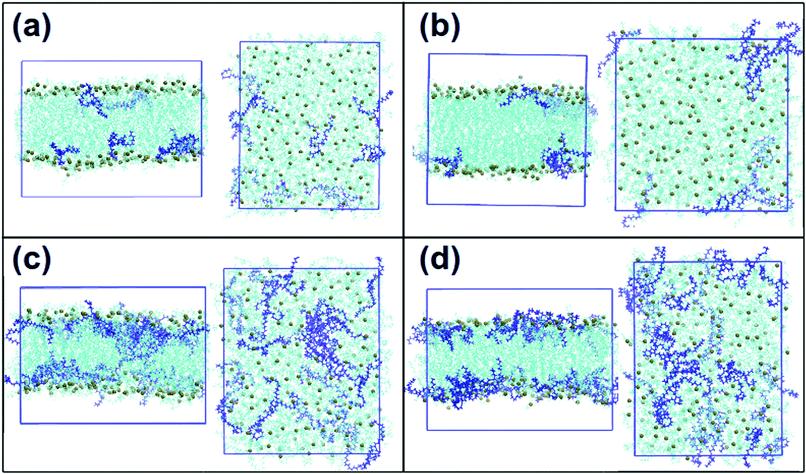
Fig. 3: Snapshots of a single frame of the system: front views and views from the top of the system. (a) DOPC and 5% of DLin-MC3-DMA, (b) DOPE and 5% of DLin-MC3-DMA, (c) DOPC and 15% of DLin-MC3-DMA and (d) DOPE and 15% of DLin-MC3-DMA. Cyan molecules are phospholipids, and the spheres in dark lime color are phosphorus. DLin-MC3-DMA is visualized in dark blue color. The images are drawn using VMD software.
In (a) and (b), no significant differences were observed in the positioning of DLin-MC3-DMA in DOPC and DOPE membranes, respectively: DLin-MC3-DMA is located close to the surfaces of the bilayers. In (c) and (d) presenting systems with lower phospholipid contents, DLin-MC3-DMA exhibited a preference for being located on the surface of the membrane with DOPE, while for the membrane with DOPC, DLin-MC3-DMA is distributed in the center of the bilayer to a large extent.
Table 2 Lateral diffusion velocity of each component in the liposome (10−7 cm2/s-1)
System | Lateral diffusion velocity of PCs/PEs | Lateral diffusion velocity of DLin-MC3-DMA |
DOPC + 5% DLin-MC3-DMA | 1.15 ± 0.40 | 1.01 ± 0.45 |
DOPC + 15% DLin-MC3-DMA | 0.94 ± 0.40 | 0.65 ± 0.40 |
DOPE + 5% DLin-MC3-DMA | 1.00 ± 0.45 | 1.15 ± 0.30 |
DOPE + 15% DLin-MC3-DMA | 0.66 ± 0.45 | 0.55 ± 0.20 |
DOPC (pure) | 0.98 ± 0.42 | - |
DOPE (pure) | 1.20 ± 0.42 | - |
The diffusion velocity of both DOPC and DLin-MC3-DMA slowed down when the amount of DLin-MC3-DMA increased in the systems containing DOPC. The addition of DLin-MC3-DMA to the systems containing DOPE reduced the diffusion velocity of both lipids more significantly when compared with the addition to the systems containing DOPC. This can used to explain why LNPs containing DLin-MC3-DMA and DOPE filed to exhibit a high transfection efficiency in plasmid DNA delivery, since the lateral diffusion and membrane fusion were the important factors in the process of DNA delivery.
Table 3 Liposome size and membrane thickness
System | Area per liposome | Membrane thickness |
DOPC + 5% DLin-MC3-DMA | 70.98 ± 0.3 | 33.9 ± 0.1 |
DOPC + 15% DLin-MC3-DMA | 73.01 ± 0.3 | 33.1 ± 0.1 |
DOPE + 5% DLin-MC3-DMA | 63.52 ± 0.3 | 37.0 ± 0.1 |
DOPE + 15% DLin-MC3-DMA | 68.46 ± 0.4 | 33.7 ± 0.1 |
DOPC (pure) | 69.00 ± 1.2 | 35.6 ± 0.1 |
DOPE (pure) | 63.35 ± 1.0 | 38.2 ± 0.1 |
As shown in the table, the liposome complexes containing DOPC have higher areas of liposomes compared with the ones with DOPE, and the average area per liposome grew as the molar ratio of DLin-MC3-DMA increased. Compared to the pure phospholipid membranes, the increase of the average area per liposome in the systems with DOPE was higher than that in systems with DOPC. However, the influence of each lipid headgroup was not reflected accurately according to the data in Table 3, since the lipid tails of DLin-MC3-DMA might also appear on the surface of the membrane; additionally, the whole cationic lipid might be located in the center of the membrane in some frames, instead of appearing on the bilayer surface. It can be concluded based on the area per liposome that the simulation systems become wider at 15 mol% of DLin-MC3-DMA.
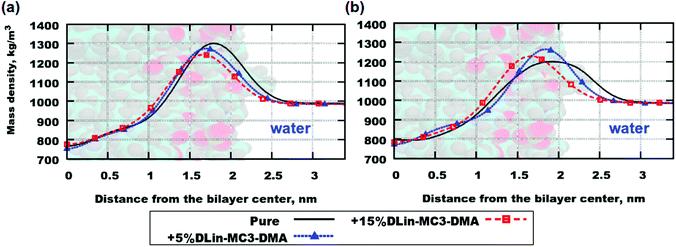
Fig. 4. Mass density profiles: (a) DOPC and (b) DOPE. "Pure" stands for lipid bilayers containing pure phospholipid.
The mass density profiles for the simulation systems and the lipid bilayers containing pure phospholipid are shown in Fig. 4. Both parts (a) and (b) in the figure showed a trend of the mass density peak moving toward the center of bilayer with increasing concentration of DLin-MC3-DMA, which can be interpreted as thinning of the bilayer, since the maximum values of mass density was associated with the position of the lipid headgroup (see Table 3 for the computed values of the membrane thickness). However, the contributions of these parts to the mass density profiles were calculated in order to obtain a picture showing the accurate location of various parts of the lipid molecule.
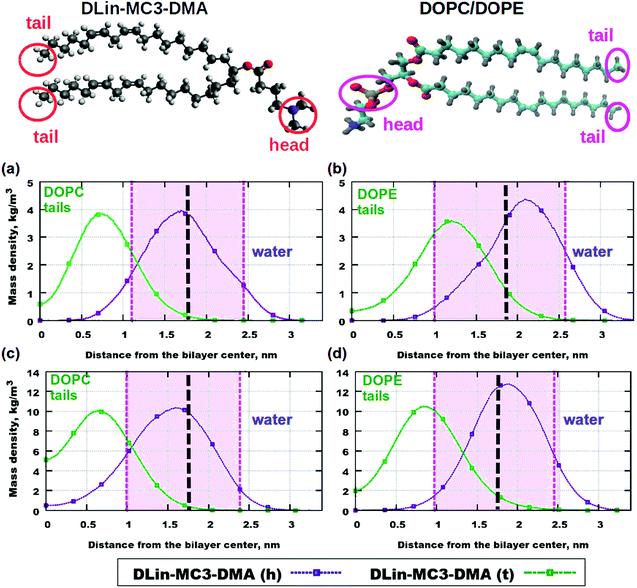
Fig. 5 Mass density profiles: (a) DOPC and 5% of DLin-MC3-DMA, (b) DOPE and 5% of DLin-MC3-DMA, (c) DOPC and 15% of DLin-MC3-DMA and (d) DOPE and 15% of DLin-MC3-DMA. The pink areas are the locations of the PO4 headgroups of the phospholipid. DLin-MC3-DMA (h) and DLin-MC3-DMA (t) represent the lipid headgroup and lipid tail, respectively. The red circles on the image of the structure of DLin-MC3-DMA denote the parts which were used for calculations of partial molecular mass density. In order to obtain a "comparable" profile, only one nitrogen and two carbons were taken from the headgroup and carbons with hydrogens were taken from the tail for calculations. PO4- groups on the picture of phospholipid structure were considered as the representatives of the lipid headgroups, while the methyl groups (CH3) in the end represented the tails. Parts of DLin-MC3-DMA are represented in different colors: light gray for hydrogen, dark gray for carbon, blue for nitrogen, and red for oxygen. Black dotted lines denote the points of maximum mass density of PO4 groups.
The contributions from the headgroups and tails of both lipids to the mass density profiles are shown in Fig. 5. The differences in profiles for the two phospholipids can be observed at the low concentration of DLin-MC3-DMA (5 mol%) (Fig. 5 (a) and (b)): the peak in the tail of DLin-MC3-DMA is located in the DOPE headgroup, while in the region of the phospholipid tails for DOPC. The headgroup of DLin-MC3-DMA appears to "prefer" the position between phospholipid headgroups in both DOPC and DOPE membranes.
The peak in the tail of DLin-MC3-DMA moved beyond the area of the DOPE headgroup at the concentration of DLin-MC3-DMA of 15 mol% (Fig. 5 (c) and (d)). While in the DOPC membrane, the position of the peak did not change compared with the concentration of DLin-MC3-DMA of 5 mol%. There was a larger amount of the tail of DLin-MC3-DMA in the center of the DOPC membrane than that in the lipid bilayer containing DOPE. The headgroup of DLin-MC3-DMA “prefers” the region of DOPE headgroups; in the membrane containing DOPC, however, a small amount of headgroups of DLin-MC3-DMA was detected even in the center of the lipid bilayer. The location of DLin-MC3-DMA was slightly similar to that observed by Ramenzapour et al. in simulations of DLin-KC2-DMA in a membrane containing POPC and cholesterol at a neutral pH.
However, lipids were not the only molecules in the simulation systems. The motion of water was affected by the motion of lipids. No significant amount of water was detected in the center of the pure phospholipid bilayers, but the addition of DLin-MC3-DMA changed the penetration of the membranes. For example, the concentration of DLin-MC3-DMA of 5 mol% contributed to the permeability of DOPE lipid membrane, which could be neglected in the membrane containing DOPC. The permeability was just the reverse at a concentration of DLin-MC3-DMA of 15 mol%, representing that the penetration of the bilayer containing DOPC was higher than that at 5 mol% of DLin-MC3-DMA, while the mass density of water for the bilayer containing DOPE was almost equal to zero.
These findings suggested that the peak of the mass density of the CH3 group in the lipid tails was observed inside the region of PO4 group at a low concentration of DLin-MC3-DMA (Fig. 5 (b)). This location in small amount of hydrophobic parts might be the reason for a proton-transfer disruption, since Brändén et al. and Yamashita et al. believed that the phosphate groups have the
"proton-collecting antenna effect" in the pure phospholipid bilayers, and the water molecules around DOPC headgroups have different preferential orientations from those around DOPE headgroups. Therefore, the presence of extraneous CH3 groups was more likely to cause pore formation in DOPE membranes compared with the lipid bilayers containing DOPC.
The water penetration of the lipid bilayers containing DOPC increased slightly with the increase in the concentration of DLin-MC3-DMA, which was correlated with the position of a small amount of headgroups of DLin-MC3-DMA in the center of the membrane containing DOPC (Fig. 5 (c)). These headgroups can act as the “transporters” for water molecules through the membrane. In the lipid bilayer containing equal amounts of DLin-MC3-DMA and DOPE, the decrease in water permeability might be caused by the slight change in the location of the lipid tails of DLin-MC3-DMA. The maximum mass density profile for the CH3 group of DLin-MC3-DMA shifted toward the carbonyl of DOPE, which could create a hydrophobic layer in that region and prevent the water molecules from passing through the membrane.
To sum up, only the effect of the different locations of these molecules on the mass density can be speculated. The slow lateral diffusion at a higher concentration of DLin-MC3-DMA might be related to the strong interaction or the phospholipid headgroups. Especially, DLin-MC3-DMA appeared to be more closely related to the phospholipid headgroups in the bilayer containing DOPE. We have calculated the radial distribution functions (RDFs) between two basis sets for elucidating the conclusion above.
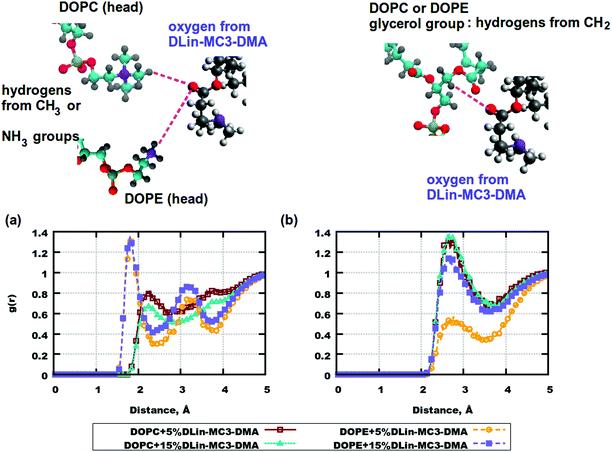
Fig. 6. Radial distribution functions (RDFs) between the atom pairs in the headgroups of phospholipid and DLin-MC3-DMA. (a) RDFs between oxygen from DLin-MC3-DMA and hydrogen from the CH3 group of DOPC/hydrogen from the DOPE amine group. (b) RDFs between oxygen from DLin-MC3-DMA and hydrogen from the CH2 group of the glycerol group in DOPC/DOPE. Parts of the phospholipids are represented in different colors: cyan for carbon, blue for nitrogen, yellow for phosphorus, red for oxygen, and gray for hydrogen. Parts of DLin-MC3-DMA are represented in different colors: light gray for hydrogen, dark gray for carbon, blue for nitrogen, and red for oxygen.
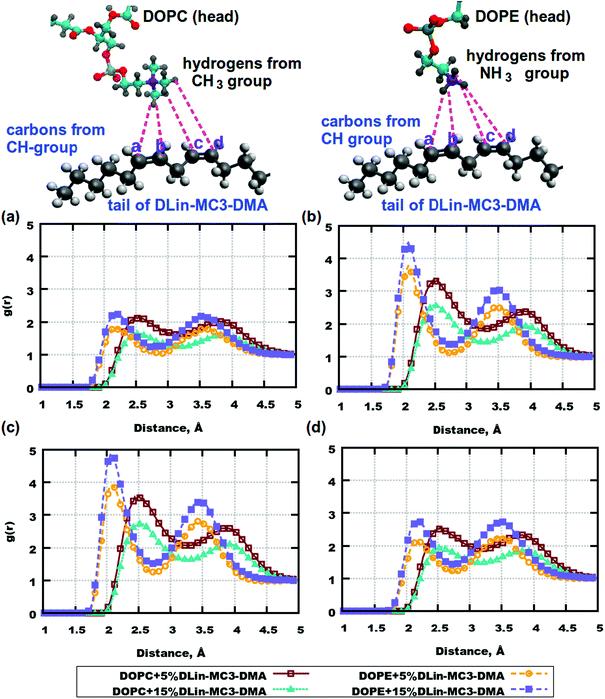
Fig. 7. RDFs between the atom pairs in the phospholipid headgroups and the tails of DLin-MC3-DMA. (a) RDFs between carbon labelled with “a” in DLin-MC3-DMA and hydrogen from the CH3 group of DOPC/hydrogen from the DOPE amine group. (b) RDFs between carbon labelled with “b” in DLin-MC3-DMA and hydrogen from the CH3 group of DOPC/hydrogen from the DOPE amine group. (c) RDFs between carbon labelled with “c” in DLin-MC3-DMA and hydrogen from the CH3 group of DOPC/hydrogen from the DOPE amine group. (d) RDFs between carbon labelled with "d" in DLin-MC3-DMA and hydrogen from the CH3 group of DOPC/hydrogen from the DOPE amine group. Parts of the phospholipids are represented in different colors: cyan for carbon, blue for nitrogen, yellow for phosphorus, red for oxygen, and gray for hydrogen. Parts of DLin-MC3-DMA are represented in different colors: light gray for hydrogen, dark gray for carbon, blue for nitrogen, and red for oxygen.
There were slight differences in the structure between membranes containing DOPC and DOPE at the concentration of DLin-MC3-DMA being 5 mol%, while clear discrepancies could be observed in the lipid bilayers containing phospholipids and DLin-MC3-DMA at the concentration of DLin-MC3-DMA being 15 mol%. A hydrophobic net of DLin-MC3-DMA was seen on the surface of the membranes containing DOPE, which was formed by the aggregations between DLin-MC3-DMA, the weak head-to-head binding between DOPE and DLin-MC3-DMA, and the relatively strong associations between the lipid tails and the DOPE headgroup. A "mixture" of different domains might be observed in the lipid bilayers containing DOPC, where DLin-MC3-DMA could be partitioned even in the center of the membrane.
Conclusion
A neutral model of DLin MC3 DMA was built in this study, and the atomistic MD simulations were carried out with this model.
The seemingly simple membrane model we constructed provided the information about certain domains formed in the complex LNP shells. It can be concluded based on the structural information obtained from calculations that at a concentration of DLin-MC3-DMA being 15 mol%, lipid bilayers were formed in the membrane containing DOPC, while hydrophobic nets were created between the phosphate groups and carbonyl groups in the membrane containing DOPE. In this simulation, these hydrophobic nets were considered as the main cause of a slow lateral diffusion at higher concentrations of DLin-MC3-DMA; the pore formation in the membrane containing DOPE with a low concentration of DLin-MC3-DMA might be caused by the proton-transfer disruption. However, the relevant information on proton-transfer disruption can only be inferred on the basis of studies, in which the similar issues were investigated using experimental or computational methods. It can be concluded that such a behavior of DLin-MC3-DMA in membranes containing DOPE only may be responsible for the poor transfection properties of these liposome complexes.
However, it may not be the best means to consider only the fusogenic properties of LNPs, as these vehicles interact with cell membranes that may have “incompatible” fusogenic properties. According to Sayers et al., the properties of cell membranes should be investigated when working on the delivery of nucleic acids. And, the use of more than one helper lipid in LNPs can also improve their properties. Epaxal® for hepatitis A and Inflexal V® for influenza were developed and approved in the late 20th century. Therefore, Molecular dynamics simulations may be considered for the investigation of lipid bilayers containing more than one helper lipid and cationic lipid in the future.
References:
Ermilova I, Swenson J. DOPC versus DOPE as a helper lipid for gene-therapies: molecular dynamics simulations with DLin-MC3-DMA. Phys Chem Chem Phys. 2020 Dec 23; 22(48):28256-28268. doi: 10.1039/d0cp05111j. PMID: 33295352.